
What is the adequation between the decompression models and the divers’ physiology if we consider the fact that most of the decompression sickness accidents (DCS) do occur in spite of the compliance with the ascension procedures?
The observation is that any decompression algorithm is only a mathematical representation of the physiological phenomenon.
Most of the accidents occur in spite of the respect of diving procedures: the divers have correctly followed the indications provided by their diving computers or their decompression tables. This situation, familiar to experienced divers, is revealing the fact that all the diving procedures (stops duration, ascent rate, gas breathed) are not necessarily adapted to all types of divers. Therefore, divers must question the relevance of the procedures they use. Given the number of possible settings of decompression algorithms, it must be noted that the divers have no tangible criteria to assess the level of suitability of the procedures to their individual physiology.
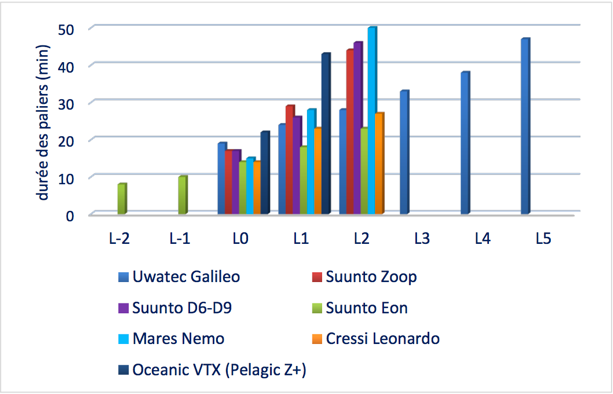
Figure 1 – Illustration of the decompression stops durations for a 30’/30m dive for seven computer models, in accordance with the conservatism levels (Source : thesis for the national instructor title – S. Le Maout, 2015)
The figure above illustrates the fact that for an identical dive of 30 minutes at 30 meters breathing air – and based on the same “0” conservatism level of dive computer, the divers will be offered 12 to 21 minutes of decompression stops, depending on the computer model. Note that this is a minimum range. In practice, divers may be offered 8 to 50 minutes of stops if the full range of conservatism levels available is taken into consideration (conservatism levels at -2 to +5).
In this context, O’Dive’s interest is to provide divers with a criterion for assessing the quality of their practice, thus giving them the possibility to better control it.
In technical diving, the variability of proposed decompression procedures is even greater (see Figure 2). The majority of rebreather or Trimix divers use the Bühlmann type decompression algorithms where the ascension profile is guided by Gradient Factors (GF).
This modelling do offer a high level of flexibility but, without tangible criteria for the management and planification of the dives, the dispersion of the proposed ascension profiles is very large.
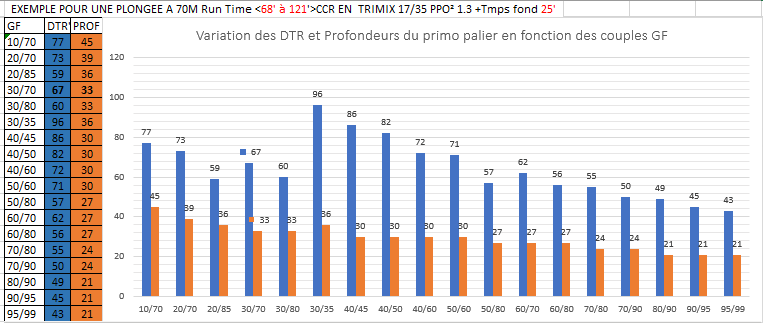
Figure 2 – The diversity of depths of proposed first dive stops and of decompression duration depending on GF for a Trimix dive of 25’ at 70m
It remains difficult to completely identify the causes leading to pathogenic bubbles. These causes are often not quantifiable, most of them are interdependent and many – especially those occurring at a microscopic level – remain unknown.
To answer the question of DCS risk prediction, modern scientific techniques use a probabilistic approach involving mathematical models. Those models integrate the quantifiable parameters contributing to the risk – or at least correlated with it – to output the bounds of risk of the accident.
With its expertise in decompression modeling [5], Azoth Systems has developed a series of predictive models called BORA (for Bubble Occurrence – Risk Attrition) to report the results observed in multiple databases. Big databases (defence, offshore) collected in the framework of collaborations and service delivery were analysed during almost 10 years: dive parameters of hundreds of thousands of dives (air, nitrox, trimix, open-circuit and closed-circuit Heliox), the bubble dynamics (Doppler measurements) of several thousand of these dives and the hundreds of accidents they led to, have been studied to calibrate these models [6] [7].
What main results does this data bring to light?
- First of all, they corroborate the previous results and allow to better define their shapes. For the air diving, the risk increases with the depth and the duration of dive and decreases when the total decompression time (stops) increases, according to a severity index Is as represented by the graph below (Figure 3). This result is obtained by the statistical analysis based on logistic regression of three defence databases accumulating more than a million of dives and about 300 cases of accidents (French Navy, US Navy and DRDC).
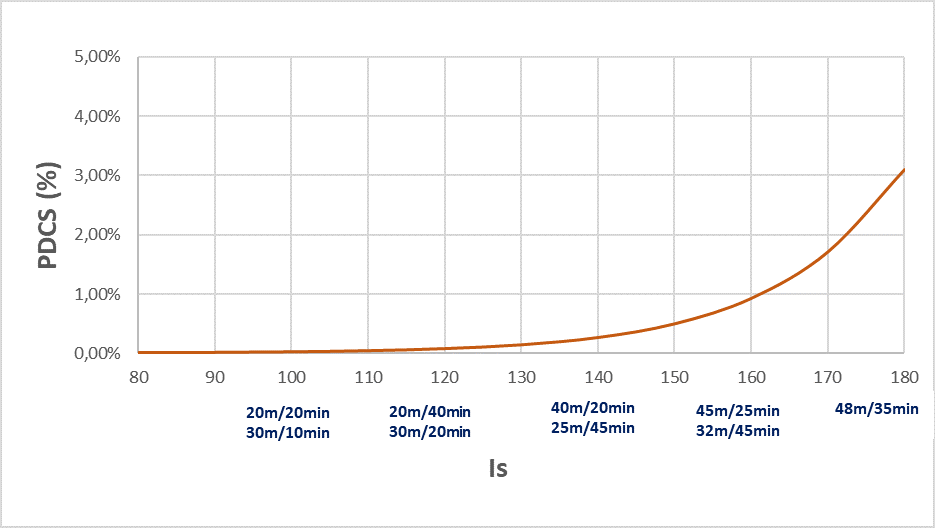 Figure 3 – The probability of DCS (PDCS) as a function of severity index Is taking into the account the depth, the duration of dive and the total decompression duration. The examples of parameters are presented as dive duration/maximal depth for the square air dives.
- The same trends were proved for deep dives (DRDC database and COMEX heritage), allowing to extend the construction of severity index Is to multi-gas setting, with:
- A major interest in the introduction of Helium in the breathing gas composition
- The interest of the oxygen-enriched breathing gas in the decompression phase
both well characterised with respect to the risk of the accident (logistic regression).
- The pic of vascular microbubbles, observable in precordial or subclavian zones after dive, is the essential data for prediction of risk : accounting for it allows to refine the DCS probability curves (Figure 4). Indeed, the presence of microbubbles acts as an amplificator of risk associated to the dive severity [7]: for dives with depths and durations necessitating decompression stops (i.e. dives on and above the security curve of no decompression) the observed risk ratio between a dive without or with few vascular microbubbles and a dive with a high bubble grade is about 10. This result is based on the analysis of a DRDC database including dive profiles, bubbles measurements in precordial and subclavian zones and accident status (more than 8000 exposures in hyperbaric chamber with more than 100 DCS).
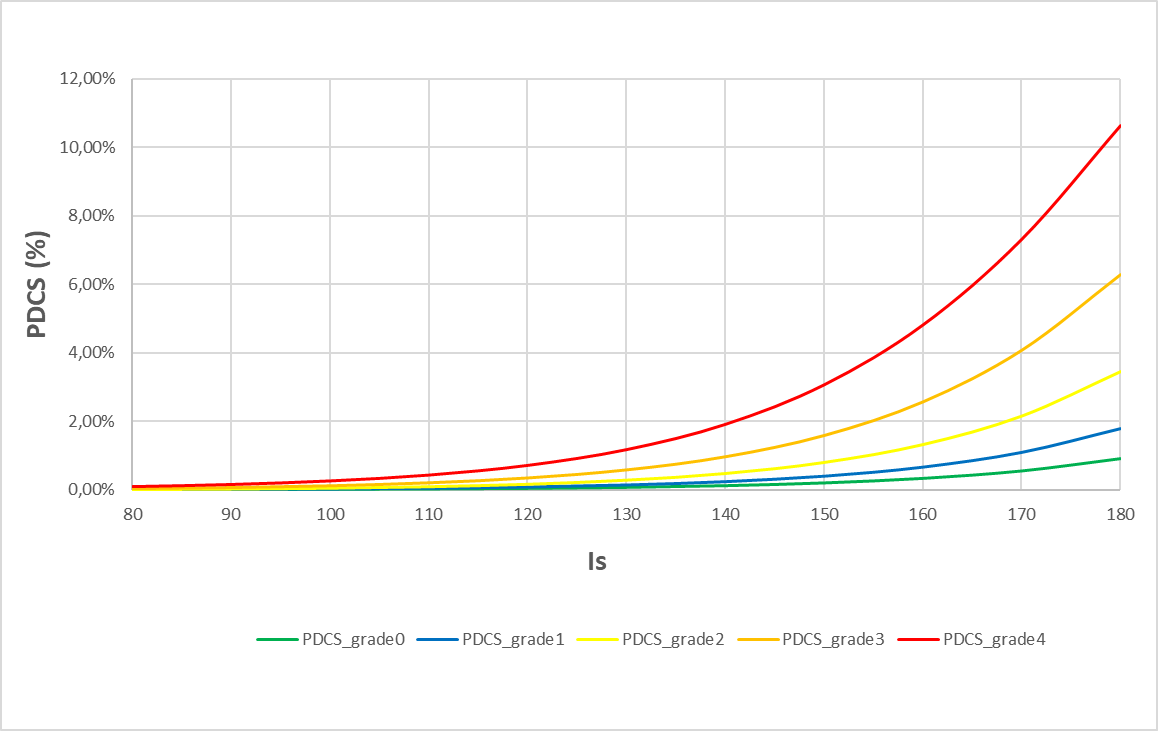 Figure 4 – DCS probability laws as a function of the dive severity index (Is) for 5 levels of post-dive microbubbles (measurements 30’ after surfacing)
- Doppler bubble measurements in subclavian zone characterize the amplification of the risk better than precordial measurements [7]
- The depth of the first stop and the ascent rate to the first stop depend on the type of breathed gas (more or less rich in Helium) and on the exposure severity (COMEX heritage). The introduction of deep stops finds its limits: Azoth cannot evaluate the benefits of deep stops when they are not in this heritage.
After each dive followed by a microbubble measurement, and based on the dive profile imported into the application, O’Dive provides divers with an information on the quality of their desaturation.
There are ideally two series of measurements, the first 30’ after surfacing* and the second 30′ later, within the optimal time interval for the bubble peak detection.
*For dives with a helium fraction higher as the nitrogen one, we recommend to perform the first series of measurements as soon as possible after surfacing, without, however, making additional efforts due to precipitation.
This indication is expressed by means of a quality index (QI) with a value ranging between 0 and 100%. It reflects a relative risk.
How is the quality index QI computed?
The QI index takes into account both the dive severity (Is index, reflecting the physiological stress associated to the dive parameters) and the level of microbubbles measured after dive using the vascular Doppler sensor.
The 100% value is a risk reference level (less than 5 per 10,000). It corresponds to the level of physiological stress experienced by a diver during a no-decompression air dive not generating any vascular microbubbles.
The QI index is computed using a simple formula
QI=100-(Sc+Bc)
with:
- Sc (Severity component, ranging between 0% and 100%): specific to the dive (exposure, decompression procedure, breathed gases), it reflects the Is index
- Bc (Bubbles component, ranging from 0% to 40%): specific to the subject’s response to the dive
As the QI index decreases, the DCS risk increases. Three zones have been identified to guide the user:
75% ~ 100% | Good quality procedure, where optimization is still possible |
50% ~ 75% | Intermediate quality procedure, with significant room for improvement |
0% ~ 50% | Procedure and/or practice to be improved (recommended) |
Statistical analysis shows, with a good confidence level, that a QI index lower than 75% is associated with a risk higher than 2 per 10 000 and a QI index lower than 50% is associated with a risk greater than 1% (lower bound of the risk).
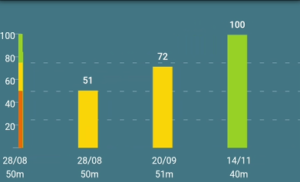
Figure 5 – Examples of IQ index for three dives (50m, 51m and 40m).
Details of the result
When the quality index does not reach 100%, the diver can access detailed information.
The decompression optimisation margin (i.e. the complement of the QI to 100%) can be visualized splitted in two components: the severity of the dive profile (Sc) and the production of vascular microbubbles (Bc).

Detail of a bargraph’s components
Note that two different dives of the same diver, with very different bubble levels, can lead to similar QI values (for example: a dive with moderate severity and many bubbles vs. a dive with high severity and few bubbles) .
The O’Dive application is divided into 4 versions: Sport, Advanced, CCR and Technical. They enable the management of all kind of dives: from open-circuit air dives to closed-circuit (rebreather) dives with Trimix diluent up to 125 meters (details available here: https://o-dive.com/commercial-offers/). In addition to the results dynamically computed for each dive, O’Dive allows to visualise the simulated effects of the modification of a set of dive parameters on the QI index.
In the Sport and Advanced versions, the diver can quantify the benefits of the following options:
- Extend the duration of the last stop
- Plan the decompression using Nitrox richer in oxygen, with a possibility to set the value up to 100%O2
- Plan the use of Nitrox as bottom gas, setting the value of %O2 up to 1.4 bar of Pp O2
- Set the Low and High Gradient Factors (GF) being guided by the application towards the optimal choices of the first stop and the total decompression time.
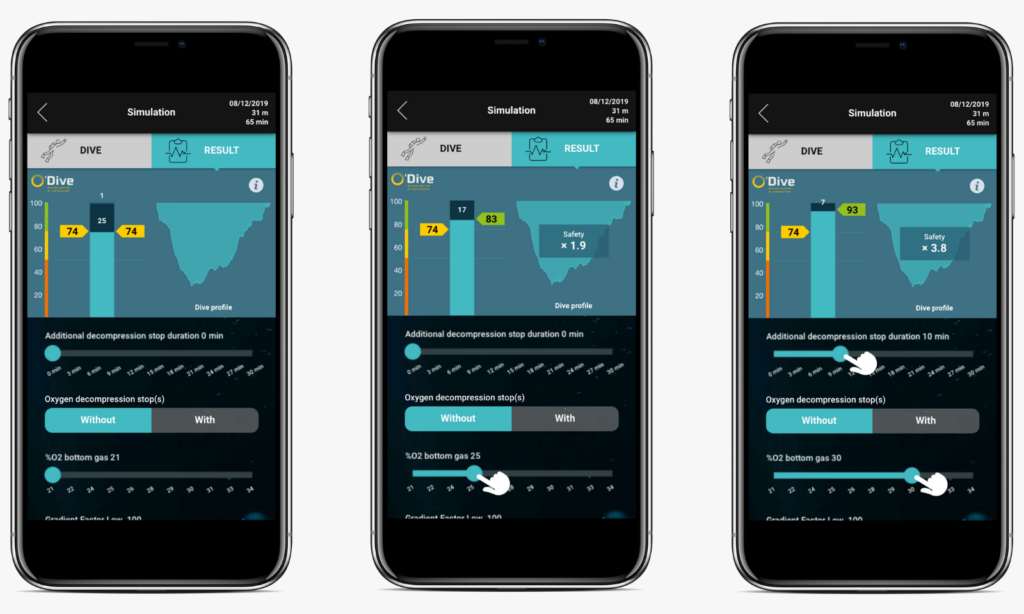
Example of 31m Air/Nitrox dive, result and planification
The CCR and Technical applications offers an extended list of functionalities, including the following simulation options:
- Extend the duration of the last stop
- Set the PpO2 value of the high set-point (closed circuit decompression)
- Plan the open circuit decompression using Nitrox richer in oxygen, with a possibility to set the value up to 100%O2
- For air dives, plan the use of Trimix as bottom gas. After setting the value of %He, the application gives the optimal value of %O2 depending on CCR or OCR mode
- Change the Trimix composition by setting different %He in CCR or OCR mode.
- Set Low and High GF being guided by the application towards the most suitable values, reflecting the choice of the first stop and the total decompression time
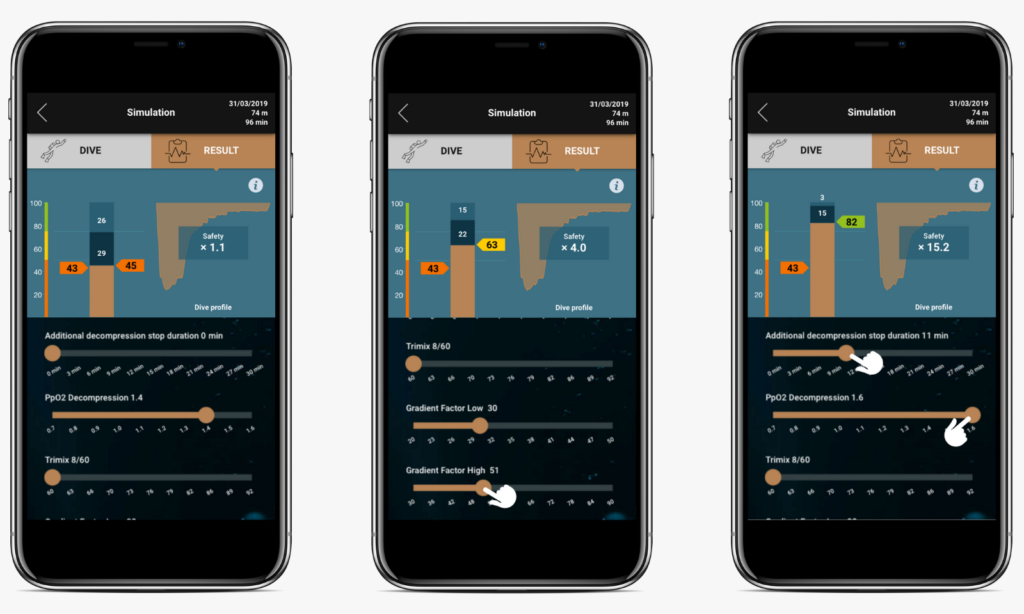
Example of 74m CCR dive, result and planification
Dive after dive, a customised model that is specific to each diver is refined to reflect as accurately as possible the added value of each of the above options on the safety.
For this purpose, the quality index QI was designed in such a way that when it increases by 33%, the diver’s safety level is multiplied by 10. This security improvement is shown in the simulation window.